Tree Segmentation
Based on LIDAR point cloud data and the ForestTools segmentation algorithm we implemented an image segmentation to derieve individual trees in the University Forest Caldern.
Interactive Report on Methods & Results
On this site you will find information about a one semester course on remote sensing and geographical information systems (GIS) at the University of Marburg.
If you are seeing this, it means you have scanned one of our QR codes or followed one of our links elsewhere. We are happy that you are interested in the results of our tree species classification as well as in our analysis of biological diversity of the University Forest Caldern! This website describes the main results of our one semester seminar to map forest structures based on RGB aerial photographs as well as LiDAR data. The reasons to create this webpage are twofold. Firstly, we thought that an interactive presentation of our findings can be a good way to make people understand and engage with it and enable them to actually create information from data and use it for beneficial purposes. Secondly, we wanted to learn how to set up and maintain a project page on GitHub as well as to explore digital means to communicate statistical findings and creating interactive mapping features.
Last, but not least, you are invited to leave your comments and ideas you may have interacting with our code and data. We hope you enjoy!
Based on LIDAR point cloud data and the ForestTools segmentation algorithm we implemented an image segmentation to derieve individual trees in the University Forest Caldern.
By implementing Random Forest classifier and combining the segmented tree layer with low-cost RGB images as spatial predictors we classifyed the species of individual trees based on a majority vote of pixels in each segment.
Using the classified tree species we retrieved some information about the spatial distribution within the forest and some structural attributes associated with the individuals of a certain species.
This map shows the results of the species classification for the University Forest Caldern.
This map indicates the level of agreement of pixels within each segmented tree ant therefore acts as an indicator for the quality of classification on the basis of individual trees.
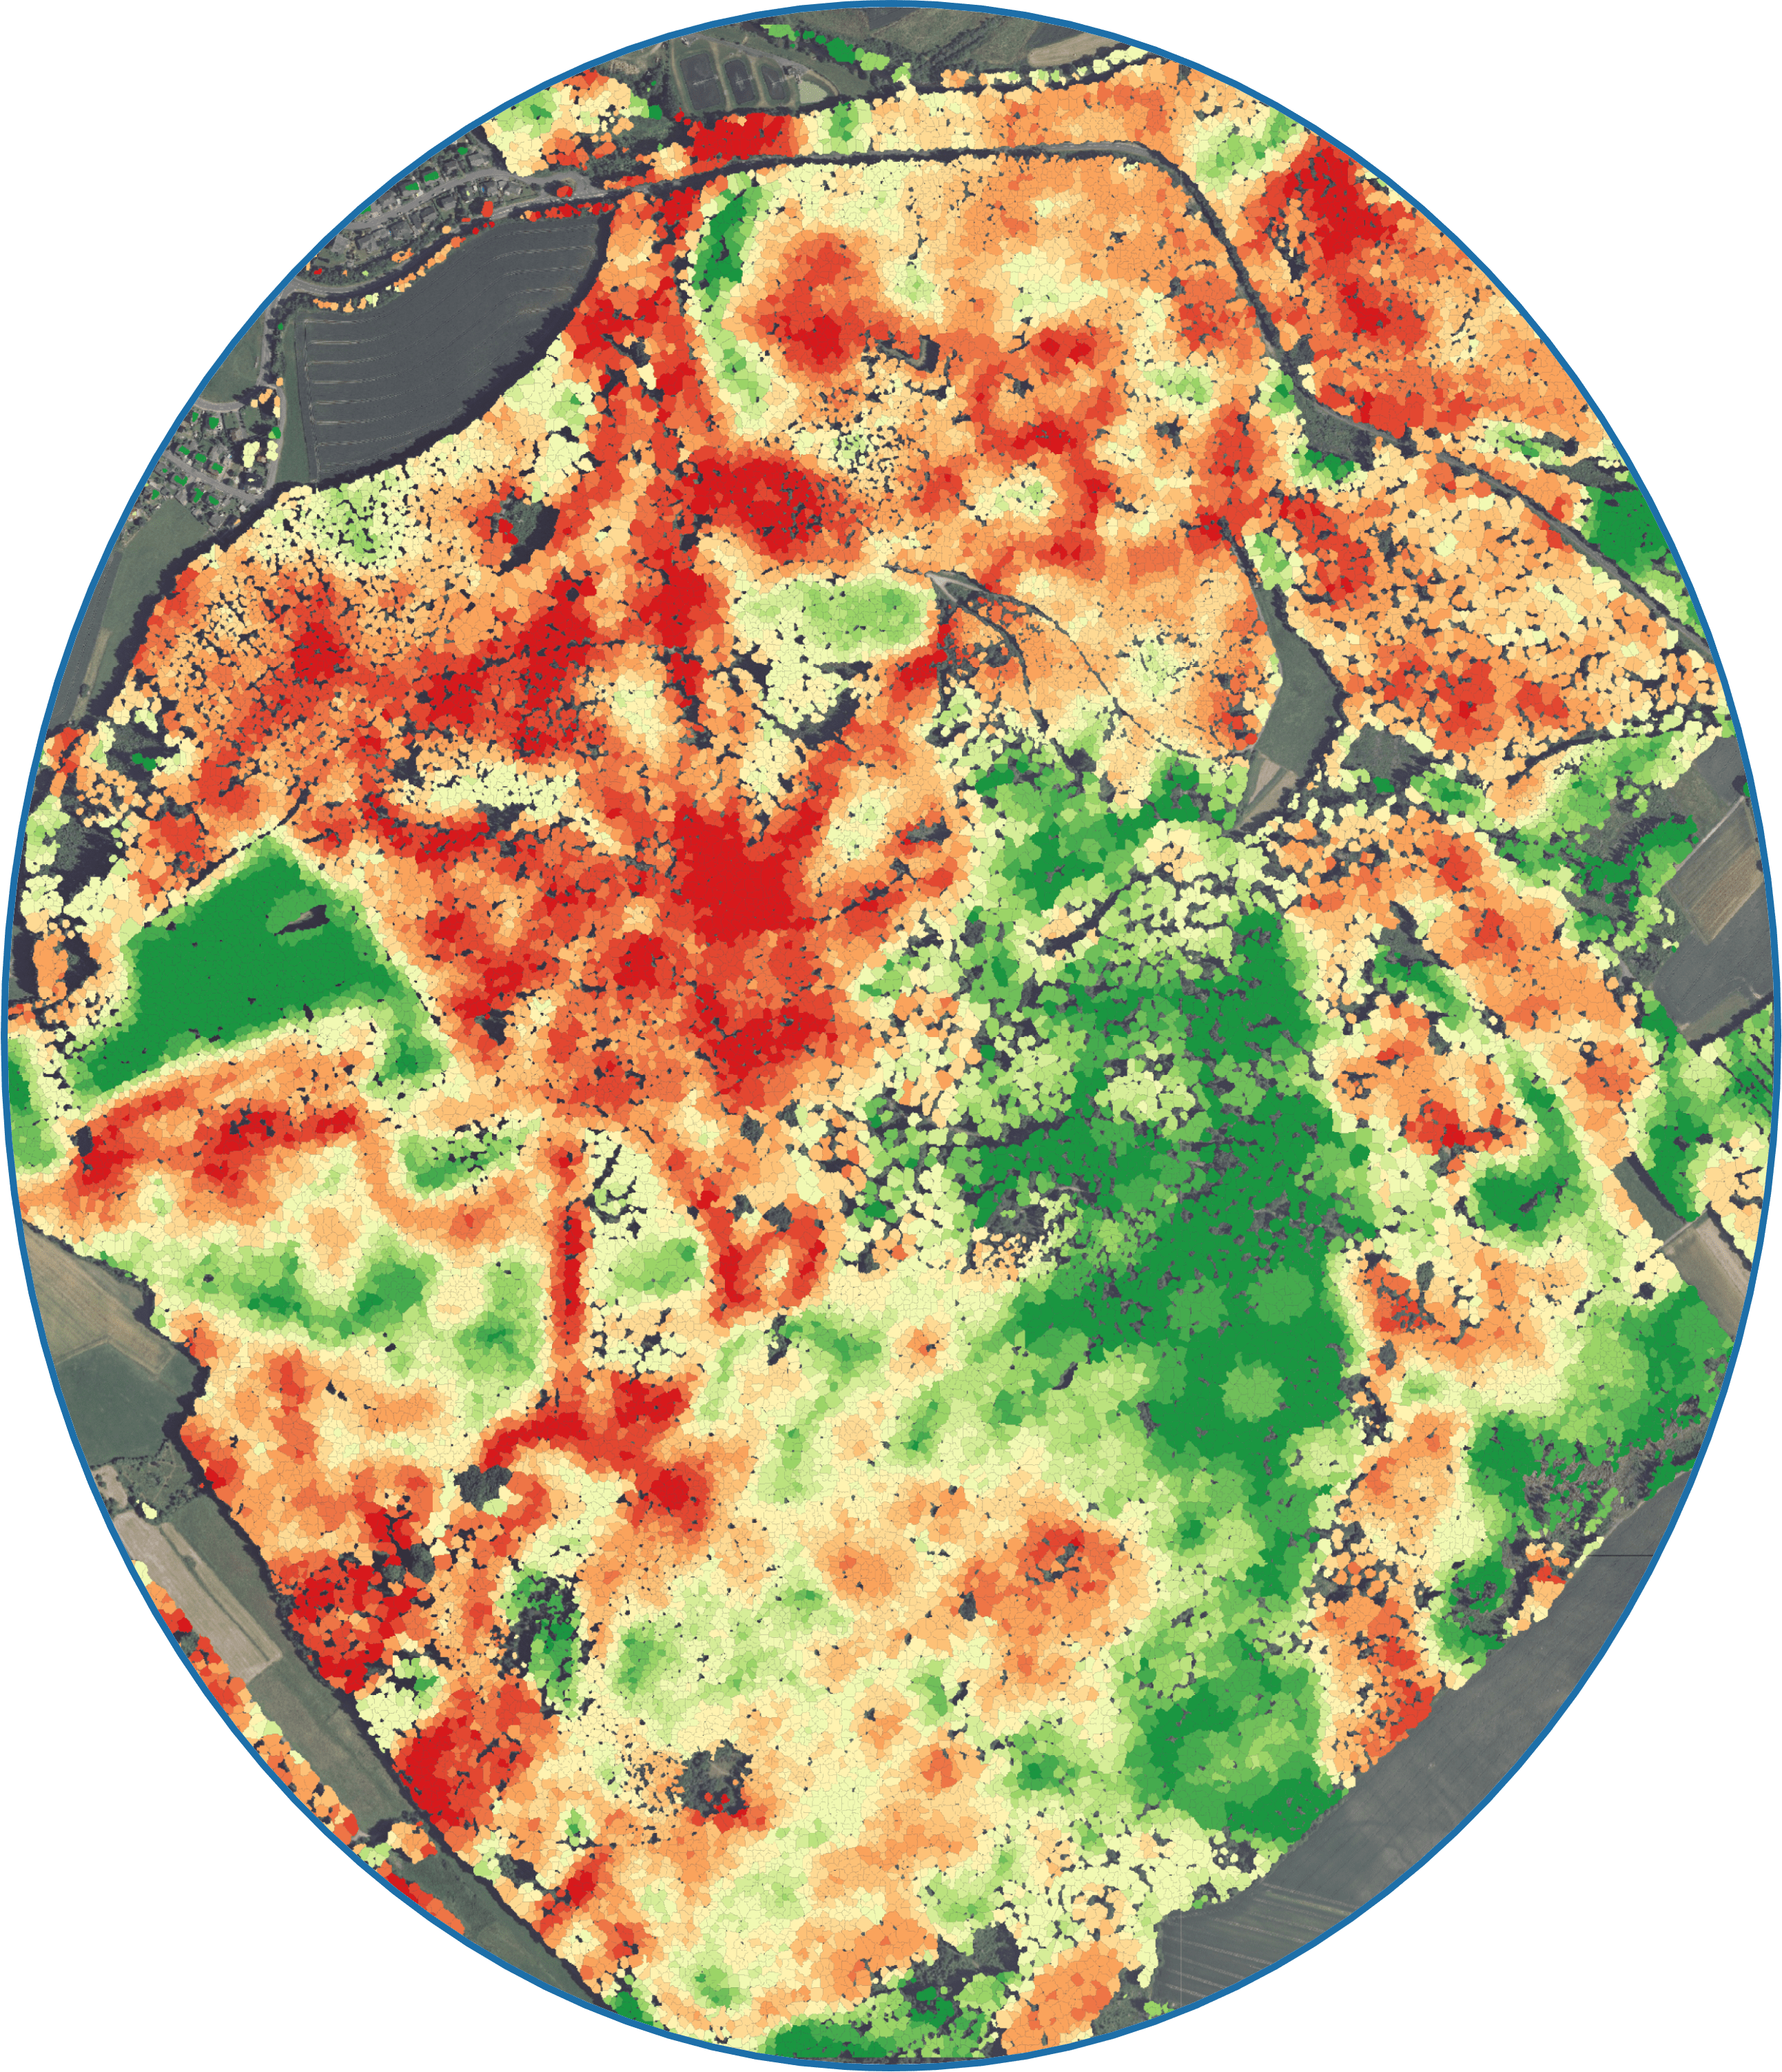
This indicator takes into account all trees within a one acre environment of each tree and calculates the shannon-weaver entropy based on the occurences of different species.
This indicator also calculates the shannon-weaver entropy, except that this time a smaller envrionment of 30 meters is used.
This indicator also calculates the shannon-weaver entropy, except that this time a smaller envrionment of 10 meters is used.
This indicator is based on LIDAR data. It represents the ratio of above ground returns to all returns and thus represents the vertical density of the vegetation. It is averaged for each individual tree.
This map show the number of direct neighbours for every individual tree and is therfor in indicator for horizontal stand density in the direct neighbourhood.