Statistics
Statistical Results
In this section we present the distribution of some of the indicators we retrieved from combining our species classification with the tree segmentation. The results are presented according to species and forest sections. On the map below, the sections of interest are coloured by the dominant species. Note, that for the ease of displaying the results some of the sections were combined together based on spatial distances.
The first two parameters are quite straight forward. These are the tree height, indicated by the highest pixel value within each segment and the total crown area. We present the results as boxplots for each of the species and for all sections of the forest. Note, that only trees which within the sections are included. In total, they consitute 21,209 trees.
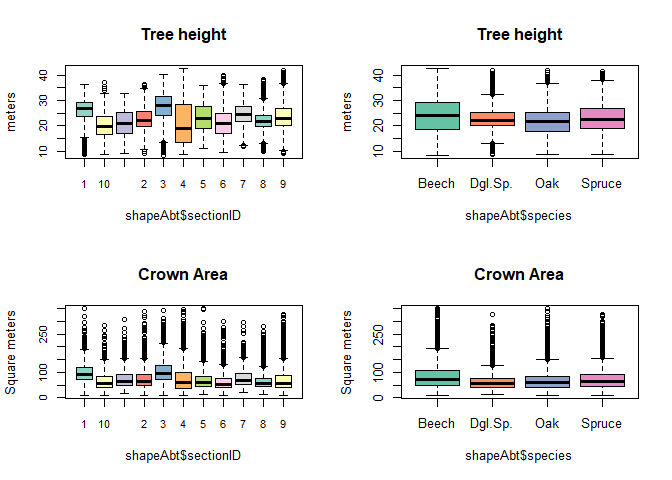
As we can see, there is not much of a difference between species when all the individuals are considered together. But if we consider the individuals within specific sections of the forest, differences become more evident.
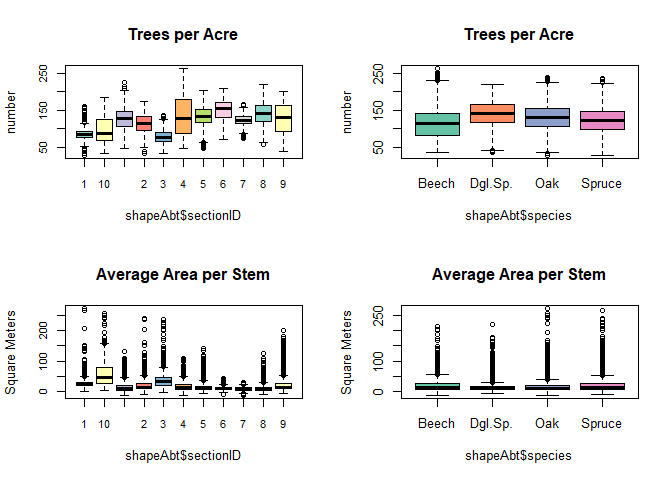
The next two parameters try to grasp this difference a little more. The first one, the number of trees within a one-acre buffer is an indicator for the density of the vegetation a tree encounters in its environment. The other one, the average free space per stem, takes the one-acre buffer, substracts the total crown area and divides the remaining amount of free space by the number of trees within the buffer. It is thus an indicator for how much space is available for an individual tree on average.
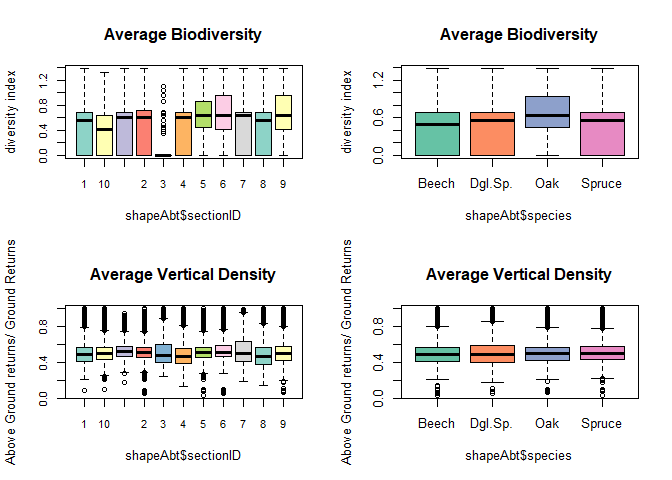
The last two parameters give some information about the biodiversity and structural vertical density of the areas surrounding trees. Biodiversity is measured by calculating the entropy of species occuring in a 10 meter environment of each tree. The vertical density of the vegetation is measured by the percentage of above-ground LiDAR returns (h>2m) per 2m².